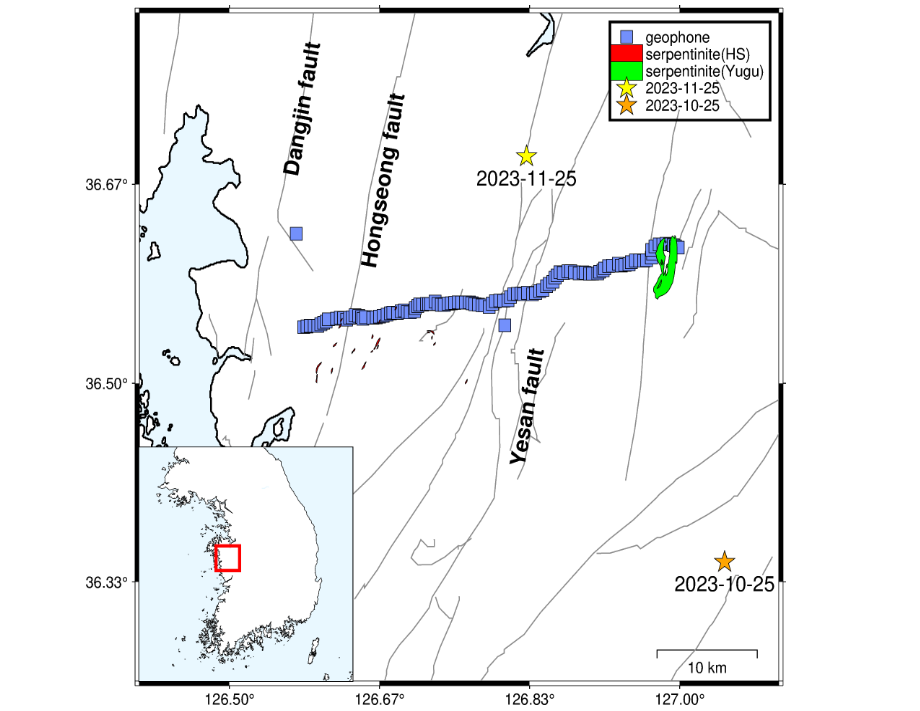
Data & Software
Total 11건
-
 Ha et al, Scientific Reports, 2025
Publication DOI: https://doi.org/10.1038/s41598-025-10026-w All numerical model results used in this study are available on an open repository, Zenodo (https://zenodo.org/records/14788420).
2025-07-13
Read More -
 The Catalog of the Oceanic Intraplate Earthquakes at the Oldest Pacific Plate
2018년 11월부터 2019년 10월까지 약 1년의 기간동안 해저면 지진계(ocean bottom seismometer)를 이용하여 판 내부 지진에 대한 위치 결정 결과입니다. 지진 카탈로그는 첨부파일에서 다운로드 받을 수 있으며, 관련 논문은 아래 링크에서 확인할 수 있습니다(https://doi.org/10.1785/0220240336). Here is the detection and location results for intraplate earthquakes using ocean bottom seismometers (OBS) over approximately one year, from November 2018 to October 2019. The earthquake catalog can be downloaded from the attached file, and the related research paper is available at the link below (https://doi.org/10.1785/0220240336). Figure. Map showing the Oldest-1 array and seismic activity. (a) Seismic array geometry and geological features. Our study area is within a 700-km radius of the array center (light gray circle). Eleven three-component broadband ocean bottom seismometers (BBOBSs) equipped with differential pressure gauges (DPGs) are shown as green triangles, with the open triangle indicating a station that recorded DPG data only. Fracture zones (FZs), indicated by dashed lines, are defined by geomagnetic reversal patterns (Nakanishi et al., 1992) and seismic profiling (Abrams et al., 1992). The thin red line indicates MTr5 seismic survey line (Kaneda et al., 2010). Ocean drilling program (ODP) site 801 of leg 129 (Abrams et al., 1992) is situated north of the station OL09, and its principal stress direction (Heidbach et al., 2016) is indicated. An open arrow indicates the direction of current absolute plate motion (APM) (Beavan et al., 2002). Plate boundaries and ages are obtained from Bird (2003) and Müller et al., (2019), respectively. Bathymetry data were obtained from GEBCO Compilation Group (2019). (b) Locations of earthquakes detected by the Oldest-1 array (red and orange circles, scaled by earthquake magnitude). White text indicates event IDs (Table 1). Cyan and magenta squares represent earthquakes reported by global earthquake catalog of Incorporated Research Institutions for Seismology (IRIS) and Wysession et al., (1991), respectively. Yellow stars indicate events reported by global centroid moment tensor (GCMT) project during our observation period.
2024-12-14
Read More -
 EARA 2024 model (Xi et al., 2024)
The EARA2024 model is available at the EarthScope/IRIS Earth Model Collaboration (EMC) repository (https://doi.org/10.17611/dp/emc.2024.eara2024.1). Figure. Mapviews of δlnVS perturbation at various depths. The reference model is the 1-D average of the 3-D model. Regions with low resolution based on the point spread function resolution test are masked out. Magenta curves represent the slab depth contour at each depth based on the Slab2 model (Hayes et al. 2018).
2024-09-25
Read More -
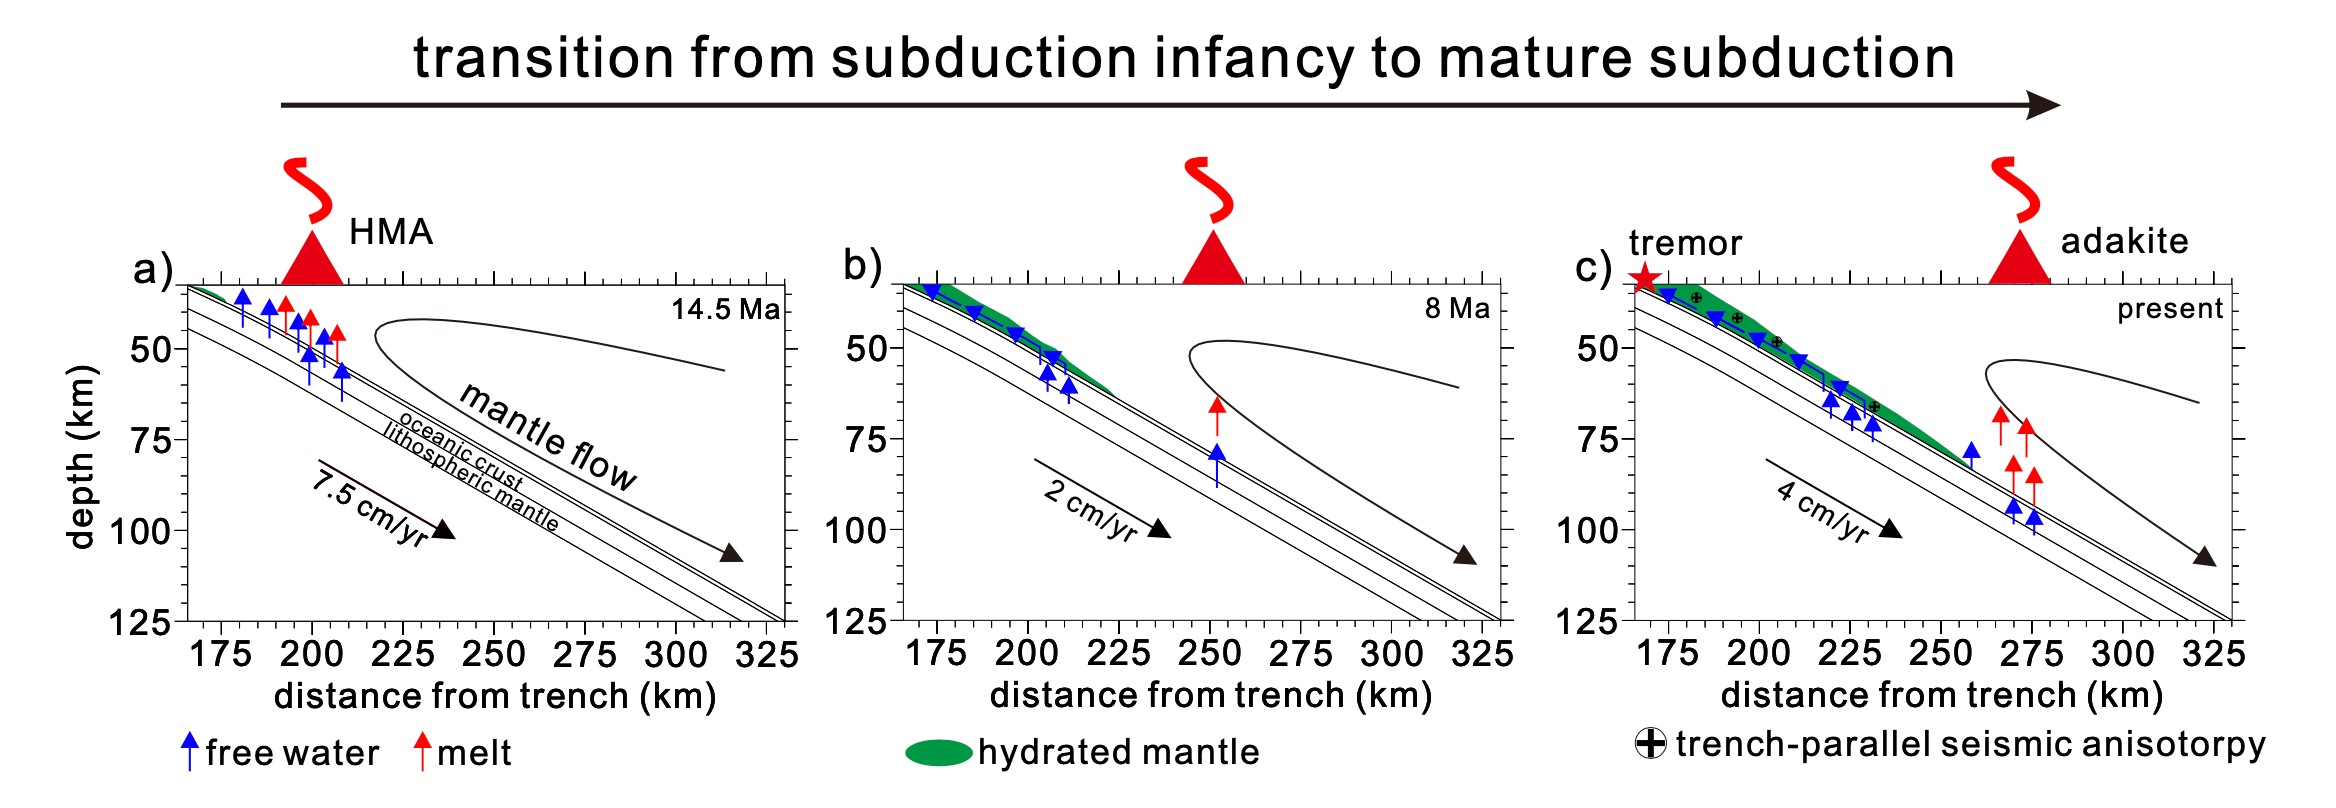 Lee and Kim, Scientific Reports (2023)
Publication DOI: https://doi.org/10.1038/s41598-023-48746-6 All numerical model results used in this study are available on an open repository, Zenodo: https://doi.org/10.5281/zenodo.7582206.
2023-12-05
Read More -
 Lee et al. (2023) - GRL: Seismic velocity of teleseismic tomography model for the vicinity of Nazca Ridge and Iquique Ridge in South America
Publication DOI: https://doi.org/10.1029/2023GL106096 (Geophysical Research Letter) 1. [Software] Toomey, D. R., & Blue Tech Seismics, Inc. (2012). July, 2012 Release [Software]. Stingray/TomoLab. Retrieved from https://pages.uoregon.edu/ drt/Stingray/pages/89.html 2. [Published Data] dVp/Vp of prescribed anisotropy tomography model. Available at: https://zenodo.org/records/10068064
2023-11-30
Read More -
 Geochemical data of Taebaeksan Basin, South Korea
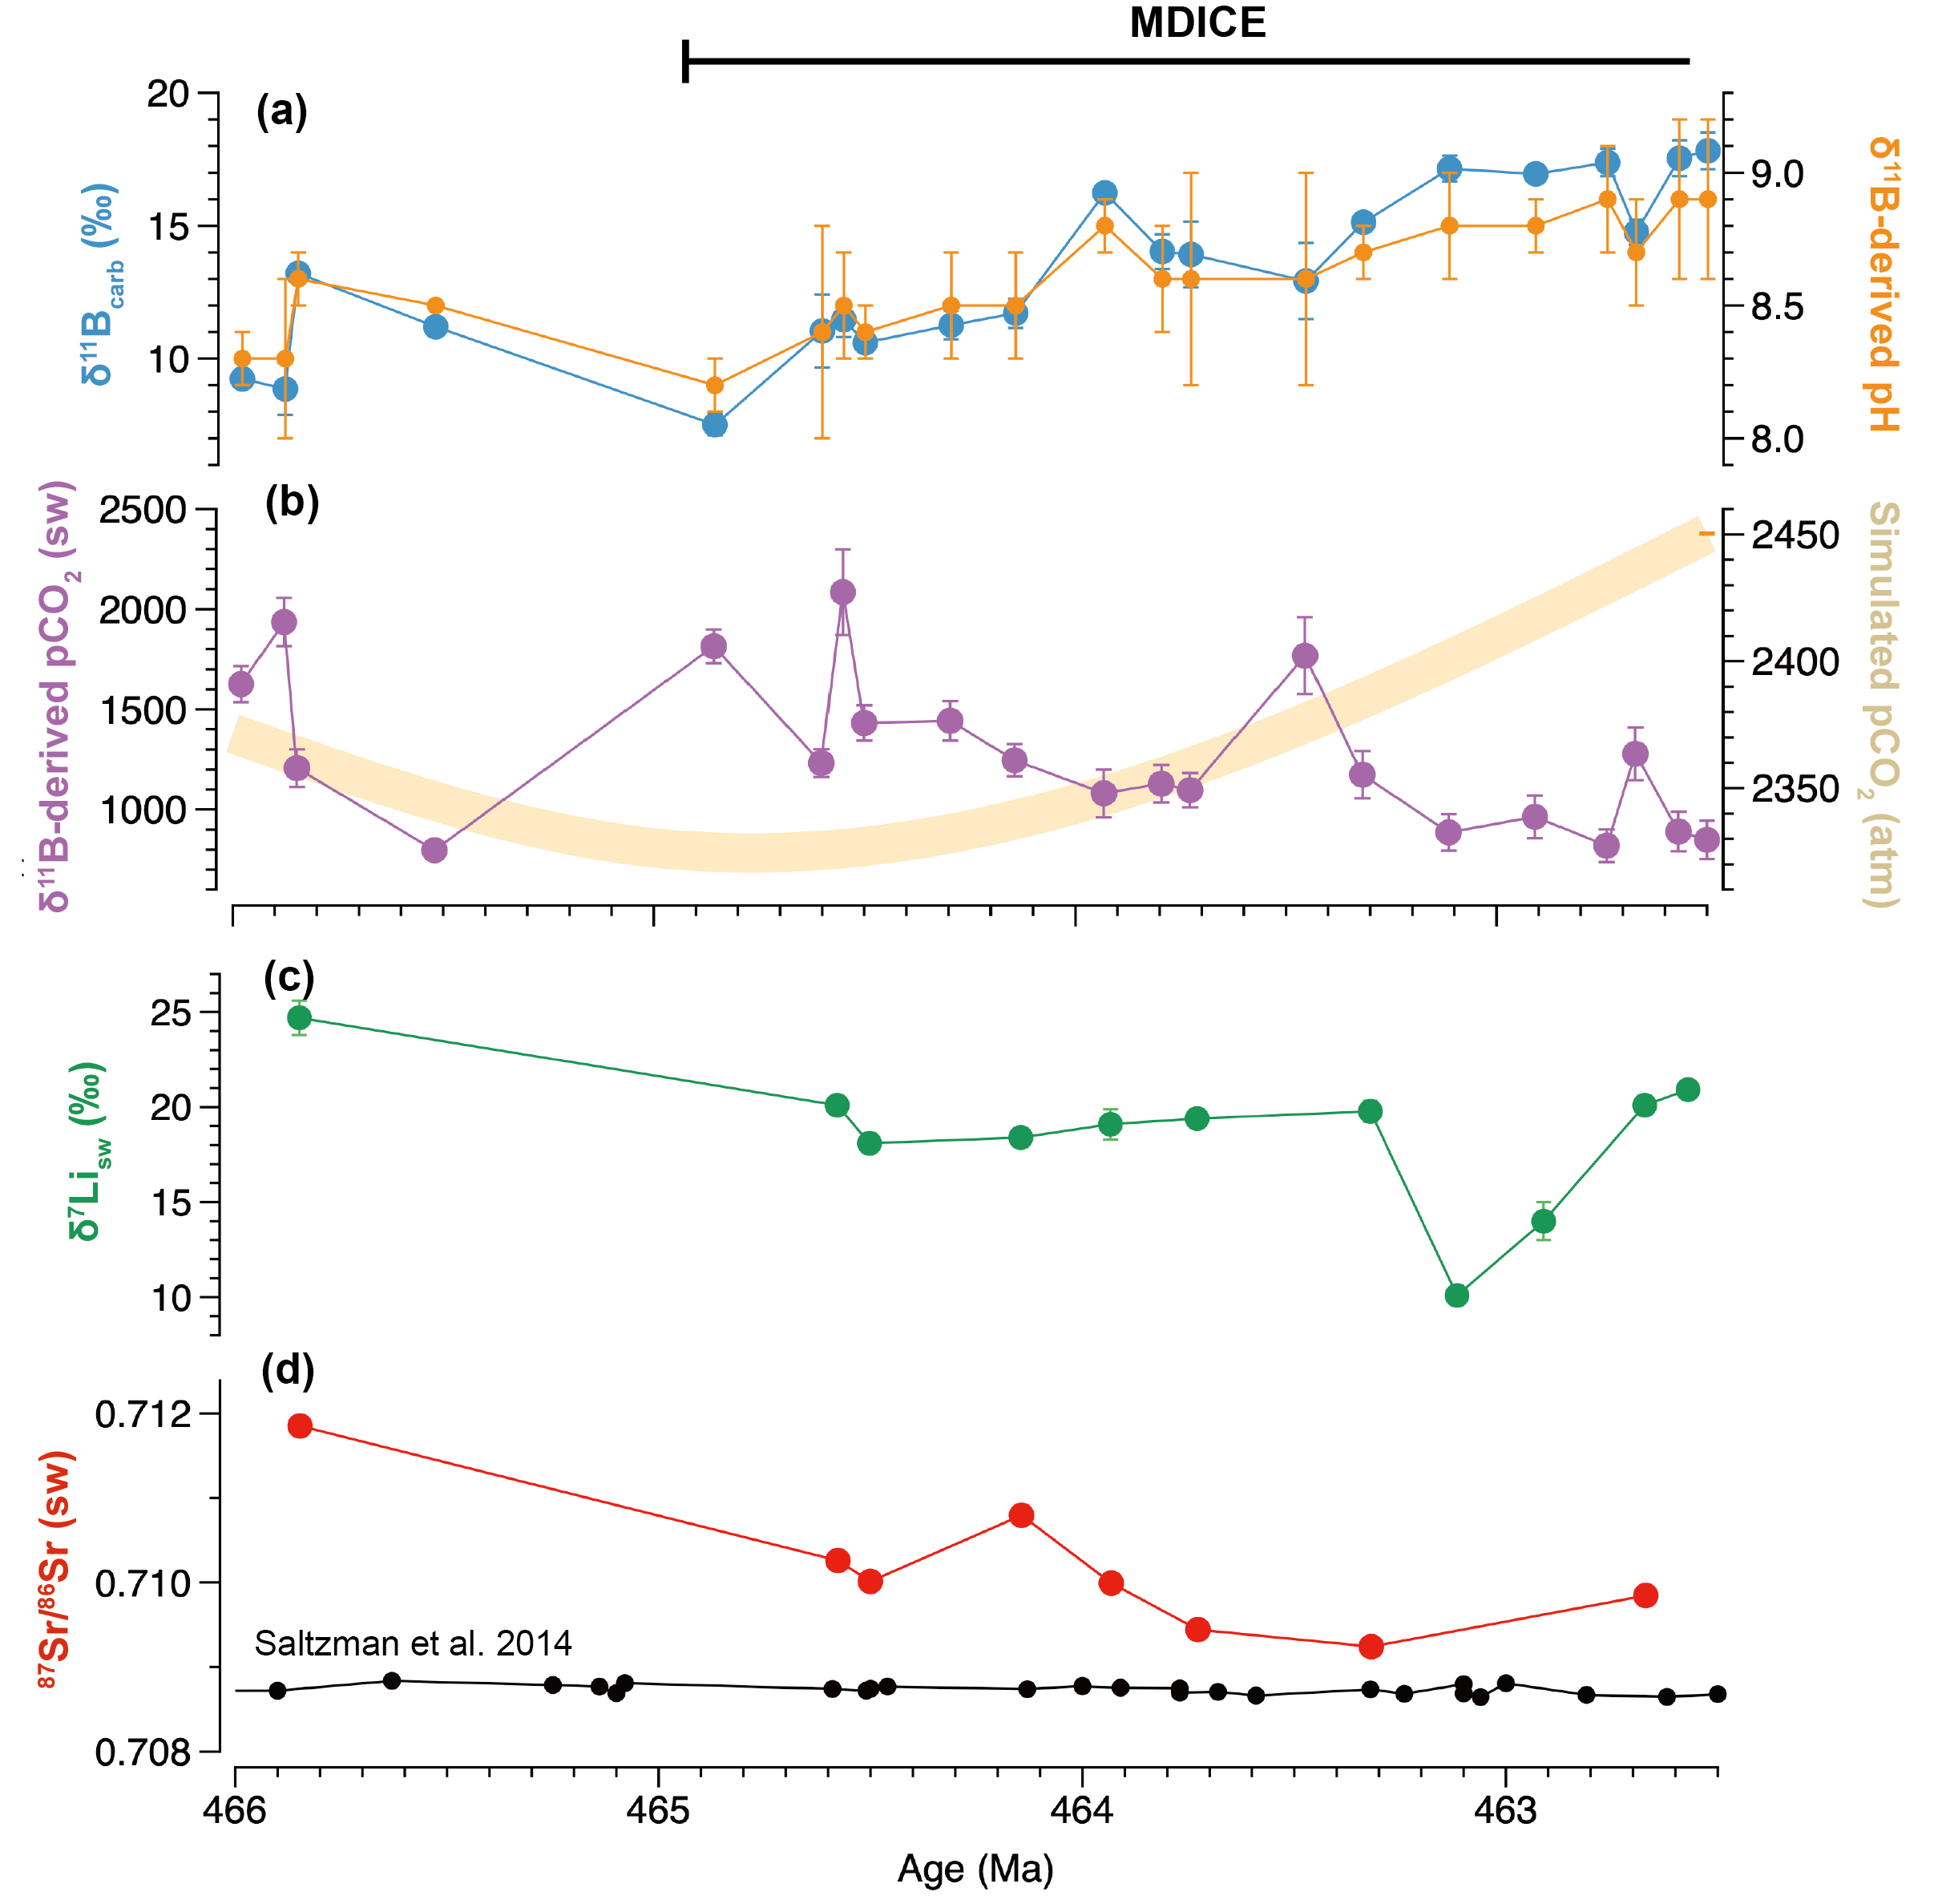
Isotopic records of the Middle Ordovician at the Joseon Supergroup of the Taebaeksan basin. (a) 𝛿11B data analyzed from the carbonate fraction of the sample and calculated pH of the Middle Ordovician seawater from 𝛿11Bcarb and estimated 𝛿11Bseawater (26.9‰). (b) Dissolved CO2 of seawater calculated from pH and DIC. Simulated atmospheric CO2 is based on GEOCARBSULF model (Royer et al., 2014; Saltzman et al., 2017). (c) 𝛿7Li data of the Middle Ordovician seawater analyzed from the carbonate fraction of the sample. The fractionation factor of 5.5‰ (derived from modern bulk carbonate rock samples; Pogge von Strandmann et al., 2021) is used to convert the isotopic values of calcite to those of seawater. (d) 87Sr/86Sr data analyzed from the carbonate fraction of the sample. The laboratory value of 60 measurements of the NIST SRM 987 standard is 0.710288 ± 0.000010 (2sd). Boron, lithium, and strontium isotopic values are analyzed using Nu Plasma 3 MC-ICPMS at the Seoul National University, Nu Plasma 3 MC-ICPMS at the London Geochemistry and Isotope Centre (LOGIC), and Neptune plus MC-ICPMS at the Korea Institute of Geoscience and Mineral Resources (KIGAM), respectively.
2023-11-06
Read More -
 Lee and Jung, Journal of Geodynamics (2023)
Lattice-preferred orientation (LPO) and seismic anisotropy of olivine from Gapyeong, South Korea. Figure 1. (a) Schematic geological map showing South Korea (modified after De Jong et al., 2015). (b) Photographs of Gapyeong amphibole peridotite and neighboring hornblendite outcrop. The red solid line indicates the boundary between amphibole peridotite and hornblendite, and the red dashed line indicates a thin serpentine layer. Foliations of both rocks are parallel to the red line. (c) Study area and geological map of Gapyeong area (modified after Lee et al., 1974). The red rectangle area in (a) is magnified. (d) Magnified geological map of the study area. The blue rectangle area in (c) is magnified. Figure 2. Pole figures (PFs) of olivine in amphibole peridotites. PFs are presented in the lower hemisphere using an equal area projection. The contours in the PFs and the numbers in the legend correspond to the multiples of uniform distribution. A half-scatter width of 20° was used. S represents the foliation and L represents the lineation. n is the number of grains analyzed. The fabric strength (M) is represented as the M-index. Figure 3. Seismic velocity and anisotropy of olivine. The P-wave velocity (VP) and seismic anisotropy of S-wave (AVS) are shown. VS1 Polarization indicates the polarization direction of the fast shear wave (Vs1). The E-W direction of each figure corresponds to stretching lineation (X), and the N-S direction corresponds to normal to the foliation (Z). Reference: Jaeseok Lee, Haemyeong Jung, Lattice-preferred orientation (LPO) of olivine and amphibole in amphibole peridotites and neighboring hornblendites from Gapyeong, South Korea and implications for seismic anisotropy, Journal of Geodynamics, Volume 157, 2023, 101977, ISSN 0264-3707, https://doi.org/10.1016/j.jog.2023.101977. (https://www.sciencedirect.com/science/article/pii/S0264370723000170)
2023-11-01
Read More -
 Korean peninsula noble gas data
Dissolved gas geochemistry of Korean natural springs, groundwater, and hot spring samples. S-wave velocity anomalies of each sample site (Song et al., 2020) are shown together. Table 1) Sample information Table 2) Computed mantle flow rate, 3He fluxes, and 4He fluxes in various porosities (Φ) References: Hong, J., Kim, H., Lee, W., Yu, J., Fischer, T.P., Takahata, N., Sano, Y., and Lee, H., 2023, Fault-related basins as carbon reservoirs: Soil CO2 emissions in the SE Korean Peninsula: CATENA, v. 231, p. 107300, doi:10.1016/j.catena.2023.107300. Kim, H., Lee, H., Lee, J., Lee, H.A., Woo, N.C., Lee, Y.S., Kagoshima, T., Takahata, N., and Sano, Y., 2020, Mantle-Derived Helium Emission near the Pohang EGS Site, South Korea: Implications for Active Fault Distribution: Geofluids, v. 2020, doi:10.1155/2020/2359740. Lee, H., Kim, H., Kagoshima, T., Park, J.-O., Takahata, N., and Sano, Y., 2019, Mantle degassing along strike-slip faults in the Southeastern Korean Peninsula: Scientific Reports, v. 9, p. 15334, doi:10.1038/s41598-019-51719-3. Song, J.-H., Kim, S., and Rhie, J., 2020, Heterogeneous modification and reactivation of a craton margin beneath the Korean Peninsula from teleseismic travel time tomography: Gondwana Research, v. 81, p. 475–489, doi:10.1016/j.gr.2019.11.016.
2023-11-01
Read More -
 The 28 October 2022 Mw 3.8 Goesan Earthquake Sequence Catalog
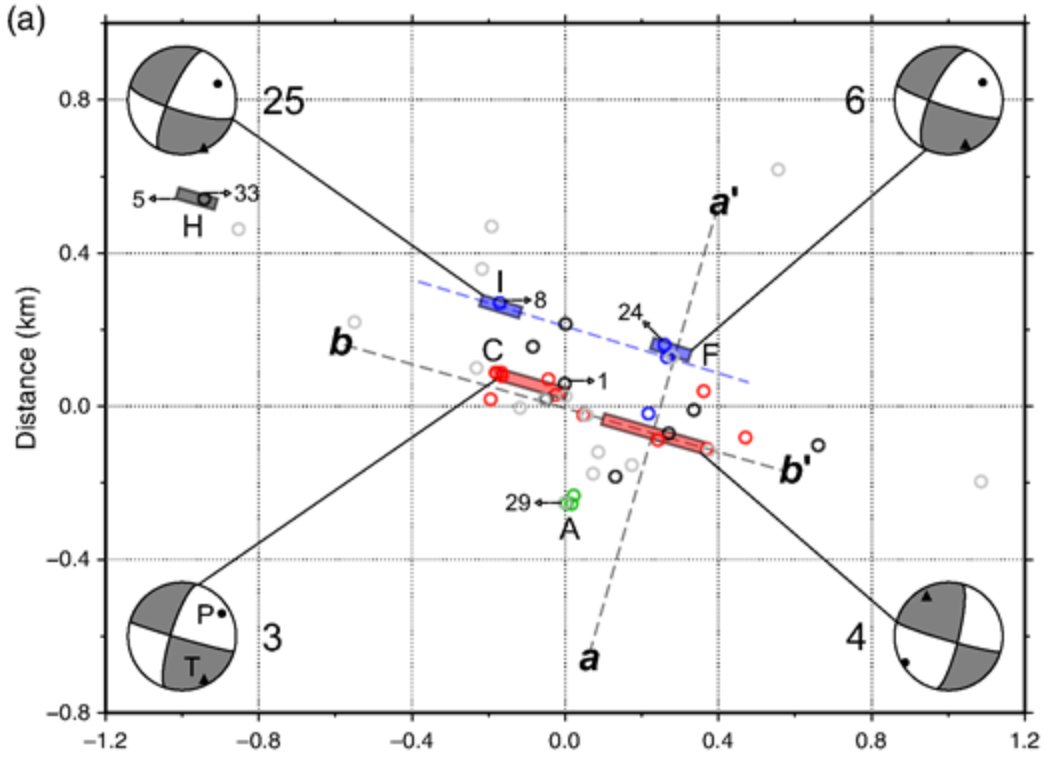
HYPOINVERSE 프로그램을 이용해 결정한 2022/10/28 Mw 3.8 괴산지진 시퀀스의 카탈로그 입니다. Kim, W. Y., Seo, M. S., Park, J. Y., Han, S., Son, Y. O., & Kim, Y. The 28 October 2022 Mw 3.8 Goesan Earthquake Sequence in Central Korea: Stress Drop, Aftershock Triggering, and Fault Interaction. https://doi.org/10.1785/0120230078
2023-09-08
Read More -
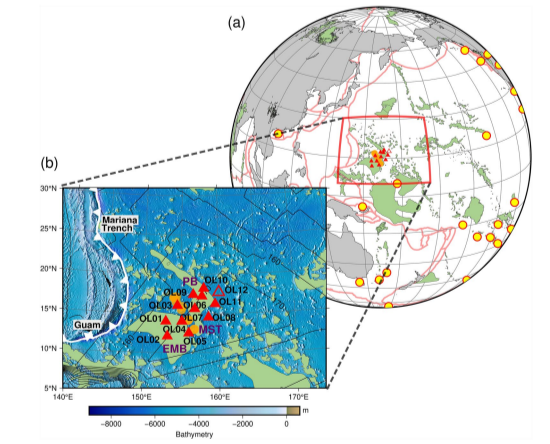 Kang et al., Geochemistry, Geophysics, Geosystems (2023)
< Broadband ocean-bottom seismic (BBOBS) data > BBOBS data acquired at the Oldest-1 experiment (Pacific Array) can be openly accessed from the Ocean Hemisphere Project Data Management Center (http://ohpdmc.eri.u-tokyo.ac.jp/dataset/campaign/obs/index.html). < Relative travel time measurements used in the finite-frequency tomography > See Table S4 of the Supporting Information file. < Software > The finite-frequency tomography code is available at https://github.com/shung302/BDFFT.
2023-08-31
Read More

